A feature that up until now was missing from Physion was the ability to create graphs. With graphs we can easily interpret data and better understand how properties of objects participating in our simulation change over time.
Graph Tool
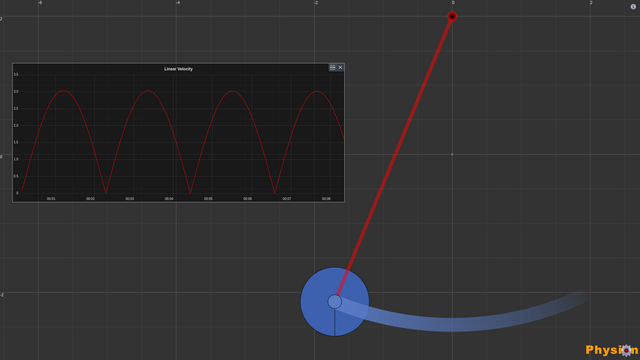
You can create graphs using the graph tool. Once the tool is selected, you can click on any body in your scene to create a graph for. After you select a body using the graph tool, a new panel will appear in your Scene:
The header of this panel contains the title of the graph (e.g. "Linear Velocity") and two buttons
on its right side. This panel will contain the graph of the selected body.
By defult the Linear Velocity vs Time will be plotted.
At the top right of the graph panel you can find two buttons; the select button will select the graph and make it available for changes in the property editor and the close button will remove the graph from the Scene.
GraphNode
The underlying node for graphs is the GraphNode. As with all other types of nodes, you can edit its properties via the Property Editor. These properties are the following:
| Property | Description | Default Value |
|---|---|---|
| bodyNodeId | The id of the BodyNode of the graph. Data for the graph is acquired from this body | "" |
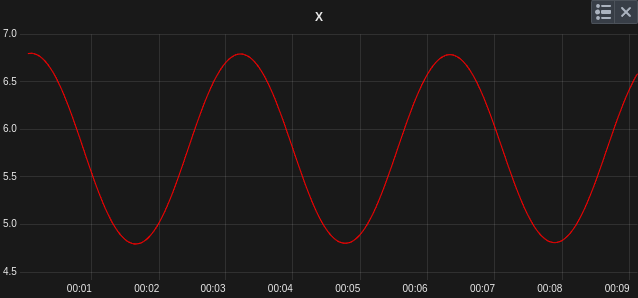
| property | The property of the BodyNode to be used in the graph. Note tha currently only the following properties are available: x position, y position, linear velocity x, linear velocity y, linear velocity, angular velocity | linearVelocity |
| paneX | The x position of the graph pane (in pixels) | 0 |
| paneY | The y position of the graph pane (in pixels) | 0 |
| paneWidth | The width of the graph pane (in pixels) | 400 |
| paneHeight | The height of the graph pane (in pixels) | 300 |
| backgroundColor | The background color of the graph pane | 0x0 (black) |
| backgroundAlpha | The background alpha of the graph pane | 0.5 |
| lineColor | The line color used in the graph | 0xff0000 (red) |
| showGrid | Whether to show grid lines for the graph | true |